Will SOL Crash to $134 As it Risks $45M Long Liquidation
In the past 48 hours, SOL has slipped from its recent high of $145 to trade around $144.48, dragging the broader market with it as Bitcoin and Ethereum also pull back slightly. The immediate driver is a looming $44.95 million in long liquidations clustered just below the $143 mark on major derivatives platforms—a level whose breach could cascade forced selling and push prices down toward $134. Technically, SOL is perched at the apex of a symmetrical triangle on the daily chart; a breakdown would validate bearish momentum and target $134, while a successful bounce could reignite the rally toward $155–$160.
Liquidation Risk and Market Mechanics
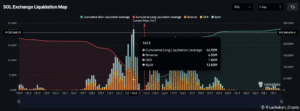
Traders’ long positions are highly leveraged, and Coinglass data shows $44.95 million of SOL longs set to liquidate if the price dips below $143, a common futures‑market “stop‑loss zone”. When such large liquidations occur, platforms automatically close traders’ positions, converting margin calls into sell orders that further depress price.. Historically, Solana has experienced rapid, two‑day pullbacks of 7–10% when forced liquidations trigger—making a drop to $134 (a further 7% below current levels) plausible under intense selling pressure.
Technical Patterns: Triangle Breakout or Breakdown?
On the daily chart, SOL has formed a symmetrical triangle with resistance near $145 and support around $142. A clear daily close below $142 would signal a breakdown and could accelerate declines toward the triangle’s measured move—approximately $134, which aligns with previous swing‐low support from late April. Conversely, a break above $145 on strong volume would negate the bearish thesis and target the next resistance at $155.
Broader Market Context
The entire altcoin sector is in a mild pullback as Bitcoin hovers around $93K and Ethereum tests support at $1,700. Inter‑market correlations remain high: when BTC and ETH bleed, SOL typically follows suit within hours. Risk‑off sentiment has been exacerbated by geopolitical uncertainties and mixed U.S. economic data—factors that hit high‑beta assets like Solana hardest.
Key Indicators to Watch
-
Funding Rates: SOL’s perpetual swap funding rates have spiked to 0.12%, indicating overheated longs. Elevated funding usually precedes sharp corrections as traders unwind positions.
-
Open Interest: Total futures open interest is at $2.1 billion, near cycle highs. A sudden drop in OI during a price decline would confirm mass liquidations.
-
On‑Chain Activity: Daily active addresses on Solana have declined by 12% in the last week, suggesting waning usage and potential selling by smaller holders.
Conclusion: Crash to $134 or Steady Higher?
Given the $45 million liquidation overhang beneath $143 and SOL’s precarious position at a triangle apex, a breakdown to $134 is a distinct possibility in the short term. Traders should watch price action around $143–$142: a sustained break below this zone, bolstered by funding‐rate‑driven liquidations, would likely trigger the drop to $134. Conversely, reclaiming and holding above $145 on strong volume would invalidate the bearish scenario and resume the rally toward $155–$160. Regardless of direction, the next 48–72 hours will be critical in determining whether SOL can escape the liquidation trap or succumb to the sell‑off.